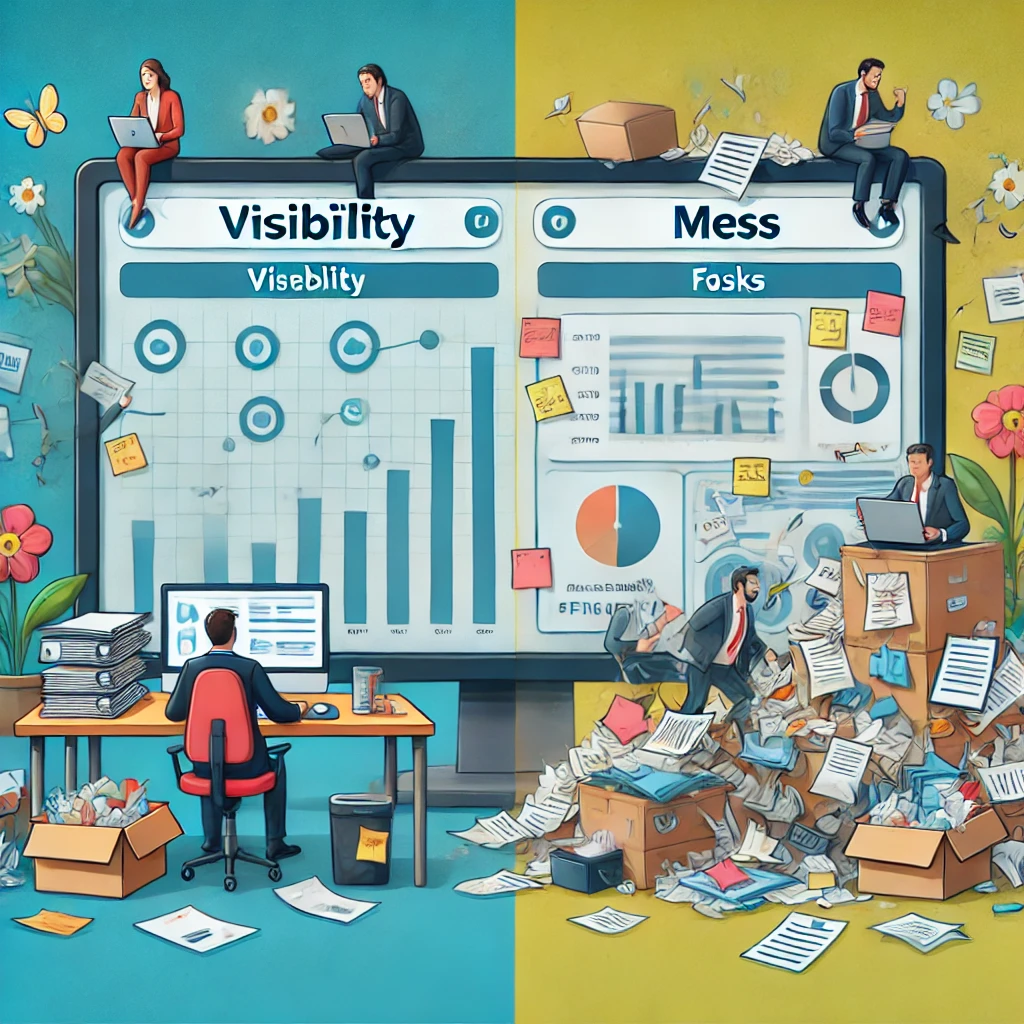
GLPI collects data on every ticket, every asset, and every process. Most organizations never use that data -- they have the system but no visibility. The dashboard is either empty or showing default charts that nobody reads.
Yet dashboards are exactly what turns GLPI from a record-keeping system into a management tool.
What a manager should see
An IT manager does not need a list of 3,000 tickets. They need answers to questions:
- Are we meeting SLA? If not, where are we failing?
- How many tickets have been open longer than 5 days? Is that number growing?
- Which categories generate the most work?
- Do we have enough people, or is the team falling behind?
GLPI 10+ lets you build a dashboard that answers these questions at a glance -- without opening reports or exporting CSV.
Practical dashboards
Helpdesk overview
Cards: open tickets by priority, average resolution time this week vs. last week, SLA compliance percentage, number of new tickets today. This dashboard should be the default screen for the helpdesk manager.
Inventory status
Assets by status (in operation / in stock / under repair / decommissioned), warranty expirations in the next 90 days, number of assets without an assigned user. Useful for the asset manager and when planning hardware refreshes.
Team workload
Tickets per agent, average first response time, backlog trend over the last 4 weeks. Do not display this as a performance leaderboard -- use it to identify overload before it starts affecting SLA.
Role-based dashboards
GLPI lets you bind dashboards to profiles. That means different people see different views:
- Helpdesk agent -- their open tickets, team queue, SLA countdown
- IT manager -- aggregated metrics, trends, SLA compliance
- CIO -- IT costs, incident count, service availability
- End user -- status of their own tickets on the self-service portal
Everyone sees what they need to make decisions in their role. Nothing more, nothing less.
When dashboards fail
A dashboard built on bad data is worse than no dashboard -- it creates false confidence. If agents miscategorize tickets, the numbers on the dashboard lie. If tickets are not closed after resolution, SLA compliance looks worse than it actually is.
Before building dashboards, clean your data: standardize categories, enforce mandatory fields, set up rules for automatic closure of resolved tickets. The dashboard then shows reality, not noise.